
.png)


TSP Funds Performance 2026: Stock Funds Post Strong First Half
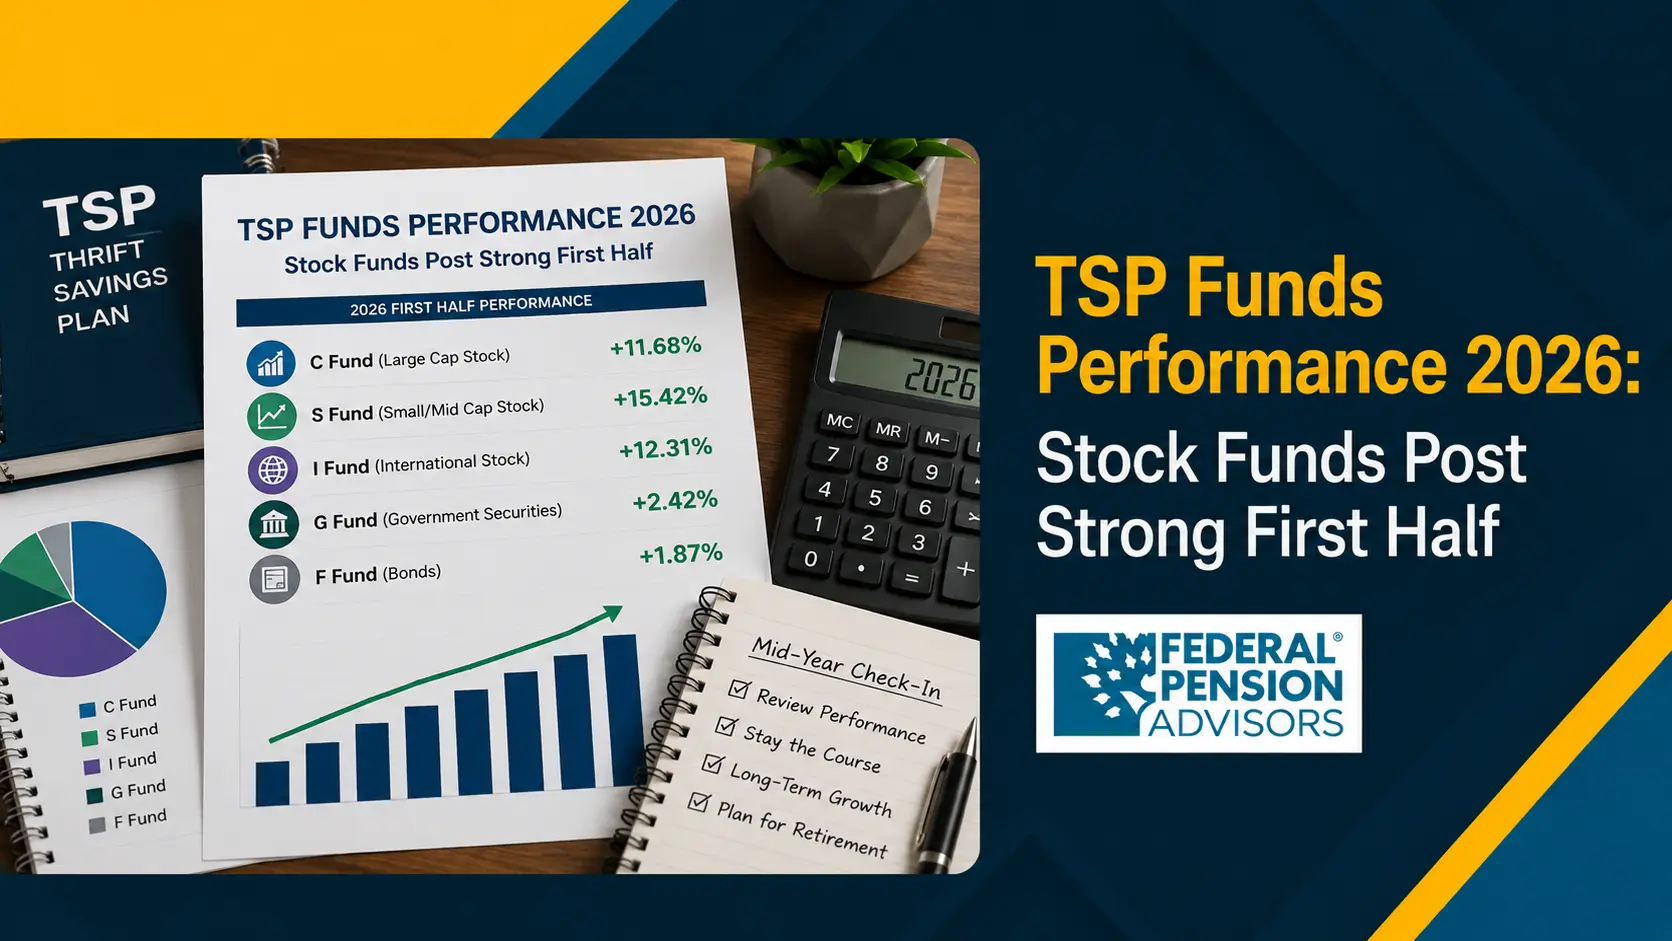
TSP funds performance through June 30, 2026 shows all three stock funds finishing the first half in positive territory, led by small-cap gains. According to FedSmith, the S Fund returned 18.41% year-to-date through June 30, the I Fund returned 16.53%, and the C Fund returned 10.20%. The TSP, or Thrift Savings Plan, is the federal government's tax-advantaged retirement savings program.
That's the headline for federal employees checking their accounts at the midyear mark. Despite a volatile spring, your equity funds delivered a strong six months.
This article breaks down each fund's returns, compares them side by side, and explains what drove the results. It also answers the questions federal workers are asking most. Federal Pension Advisors, a retirement planning firm specializing in federal employee benefits, prepared this midyear review to help you understand where your retirement savings stand.
First-Half Results at a Glance
The three TSP stock funds all posted gains through the first half of 2026. But the leadership order shifted sharply from prior years.
The S Fund led with an 18.41% year-to-date return through June 30. The I Fund followed at 16.53%, and the C Fund came in at 10.20%.
This is a notable reversal. In 2025, the I Fund was the runaway winner, and large-cap U.S. stocks had dominated for much of the prior decade.
Each core stock fund tracks a different slice of the market. The C Fund (Common Stock Index Investment Fund) tracks the Standard & Poor's 500 (S&P 500) Index of large U.S. companies. The S Fund (Small Capitalization Stock Index Investment Fund) tracks the Dow Jones U.S. Completion Total Stock Market Index of small and mid-sized firms.
The I Fund (International Stock Index Investment Fund) tracks the MSCI ACWI IMI ex USA ex China ex Hong Kong Index. That index covers non-U.S. developed and emerging market stocks. Knowing which fund holds what explains why their 2026 paths diverged so widely.
How the Three Stock Funds Compare
The table below compares the three TSP stock funds across the metrics that matter most for a midyear review. All figures are sourced from FedSmith and reflect data as of June 30, 2026.
The S Fund's 18.41% year-to-date return was the best of any core stock fund for both June and the year so far. The I Fund's 30.05% trailing 12-month return was the strongest 12-month figure of any TSP core stock fund.
These numbers show why you should review your allocation across all three funds rather than chase a single year's winner. Federal Pension Advisors makes that point with clients regularly.
What Drove the Strong First Half
The strong first-half performance came from a broad rally that eventually reached beyond the largest technology companies. The S Fund gained 4.34% in June alone. Artificial intelligence (AI) infrastructure spending spread beyond the biggest technology firms into smaller companies, and that surge pushed small-caps ahead of large-caps for the year.
The path was far from smooth. The TSP started 2026 with every fund positive in January. The I Fund then jumped 6.05% in February to lead early.
A sharp reversal followed. The three stock funds gave back gains in March, and two finished the first quarter negative. The S Fund alone posted a 4.58% loss that month.
The recovery was decisive.The S Fund then posted three consecutive positive months in April, May, and June.
The I Fund's story reflects a longer rotation. International stocks lagged U.S. markets for many years. They were among the strongest TSP performers through mid-2026, building on the I Fund's exceptional 32.45% return in 2025.
Why the C Fund Trailed the Other Stock Funds
The C Fund posted a solid first half but finished behind its two equity siblings for a specific reason. Large-cap U.S. stocks had a choppier year than small-caps and international stocks.
The C Fund is up 10.20% year-to-date and 22.31% over the trailing 12 months through June 30, 2026. Those are strong absolute numbers, just not the leader.
The C Fund dropped 0.95% in June, alternating between gains and losses in five of its first six months. That volatility was tied in part to uncertainty over the Federal Reserve's rate outlook.
The C Fund remains the largest stock fund in the TSP, holding 34.5% of participant assets with $398.3 billion allocated. For most federal employees, the C Fund still forms the core of your equity exposure even in a year when it didn't top the leaderboard.
Where TSP Participants Are Putting Their Money
TSP participants have been shifting more assets toward the I Fund, a pattern worth watching carefully.
The I Fund now holds 13.2% of TSP individual fund assets, or $152.4 billion, as of May 31, 2026. That reflects growing participant interest after the fund's exceptional 2025 and strong start to 2026.
This kind of performance-chasing carries risk. The I Fund can be volatile because it includes international equity and currency exposure. The S Fund also carries higher volatility because it holds small and mid-sized companies.
Fund leadership can change quickly, as the March 2026 reversal showed. The Federal Retirement Thrift Investment Board (FRTIB) reported 7,325,267 total accounts as of the end of May 2026. The average balance was $157,797 across all account types.
FERS participants made up the largest group. Their average balance was $233,829, per the FRTIB's June 2026 board materials. FERS is the Federal Employees Retirement System, which covers most federal workers hired since 1984.
How the Stock Funds Fit a Federal Retirement Plan
The three TSP stock funds are building blocks, not competing bets. A diversified mix reduces your exposure to any single market's downturn.
The C Fund covers large U.S. companies. The S Fund covers smaller U.S. companies. The I Fund covers international markets. Owning all three, often alongside the bond-oriented G Fund and F Fund, produces a more globally diversified portfolio than any one fund alone.
Federal Pension Advisors works with federal employees to align TSP allocation with time horizon and risk tolerance rather than recent performance. Consider a common planning scenario. A FERS employee within ten years of retirement reviews whether a heavy tilt toward a single top-performing fund, like the I Fund after its 2025 run, has quietly raised portfolio risk beyond what their retirement date can absorb.
The firm coordinates TSP strategy with FERS annuity projections and Social Security timing to build a complete income picture. This is educational information about federal benefits, not individualized investment advice.
The Bottom Line for Federal Employees
The 2026 TSP funds performance story through the first half is one of strong but uneven equity gains, with small-cap and international stocks leading large-caps. The S Fund's 18.41%, the I Fund's 16.53%, and the C Fund's 10.20% year-to-date returns all landed in positive territory despite a volatile March.
The clearest lesson from the first six months is that fund leadership rotates. The I Fund's 2025 dominance gave way to the S Fund's 2026 surge. That's precisely why diversification across funds matters more than picking last year's winner.
Federal Pension Advisors helps federal employees translate TSP performance into a coordinated retirement plan alongside their FERS annuity and Social Security. To review how your current TSP allocation fits your retirement timeline, schedule a consultation with our federal benefits specialists. For the most current fund returns, verify figures at TSP.gov, the official Thrift Savings Plan website, before making any allocation decisions.
Frequently Asked Questions
1. What are the best-performing TSP funds in 2026?
The best-performing TSP fund in the first half of 2026 was the S Fund, which tracks small and mid-sized U.S. companies. According to FedSmith, it returned 18.41% year-to-date through June 30, 2026, ahead of the I Fund at 16.53% and the C Fund at 10.20%. All three stock funds finished the first half positive.
2. How did the TSP C Fund perform in 2026?
The TSP C Fund, which tracks the S&P 500 Index of large U.S. companies, returned 10.20% year-to-date through June 30, 2026. It also gained 22.31% over the trailing 12 months. The C Fund had a choppy first half, dropping 0.95% in June amid uncertainty over Federal Reserve interest rate decisions.
3. Why is the TSP I Fund doing so well?
The TSP I Fund, which holds international stocks, has benefited from strong international market performance in 2026, along with a broader rotation beyond U.S. large-cap stocks. The I Fund returned 16.53% year-to-date through June 2026 and 30.05% over the trailing 12 months. That's the best 12-month figure of any core TSP stock fund.
4. Should I move my TSP money to the best-performing fund?
Chasing the top-performing TSP fund carries real risk because fund leadership changes quickly. In March 2026, the stock funds reversed sharply, and two finished the first quarter negative. Financial educators generally recommend choosing an allocation based on your risk tolerance and retirement timeline rather than recent returns.
5. What is the difference between the TSP C, S, and I Funds?
The TSP C Fund holds large U.S. companies in the S&P 500 Index. The S Fund holds small and mid-sized U.S. companies not in the S&P 500. The I Fund holds international stocks outside the United States. Together, the C and S Funds provide broad exposure to large, mid-sized, and smaller U.S. companies, while the I Fund adds global diversification.
6. How many TSP accounts are there in 2026?
The Thrift Savings Plan held 7,325,267 total accounts as of the end of May 2026, according to the FRTIB's June 2026 board materials. The average balance across all account types was $157,797. FERS participants formed the largest group, with an average balance of $233,829, well above the industry-wide average 401(k) balance.
Disclaimer
This article is for educational purposes only and should not be considered individualized investment, tax, or retirement advice. TSP fund returns change over time, and past performance does not guarantee future results. Federal employees should review current figures at TSP.gov and consult a qualified financial professional before making allocation or retirement planning decisions.

Get Updated
Subscribe to our weekly updates for the latest on retirement planning, federal benefits, exclusive webinars, and more!

Thomas A. Doherty
Thomas A. Doherty is a Retirement Planning Consultant with more than 35 years of experience helping federal employees, academic professionals, business owners, and retirees make informed retirement decisions. He specializes in federal benefits, pension planning, Social Security strategies, tax-efficient retirement planning, and retirement income planning. Thomas works with clients nationwide, helping them understand complex retirement rules and build personalized income strategies designed for long-term financial confidence.

Download Federal Retirement: Step-by-step Checklist
This comprehensive guide will help you understand your federal benefits, optimize your savings, and plan for a comfortable future.